Economy & Markets #20 - Portfolio Diversification, Top Investors, Women at the Helm, and the Recovery of Gold


This week's topics:
The classic 60/40 portfolio
Many of our competitors still use a 60/40 portfolio, with 60% in stocks and 40% in bonds. However, the strategic asset mix of our defensive and neutral model portfolios shows that at Tresor Capital, we are not strong advocates of holding bonds at current interest rate levels. We only include high-yield bonds, insurance-linked bonds, and fallen angels in the defensive and neutral profiles. Three key arguments underpin this divergent view.
- Bonds are not very attractive from a tax perspective
In Belgium in particular, taxes (withholding tax, Reijnders taxes) significantly erode the net return compared to the gross return. In the Netherlands, too, bonds often struggle to achieve the minimum required net return. Currently, a flat-rate return of 6% applies with a tax rate of 36%, or +2.16%, which must be paid on the invested capital in the Netherlands. Inflation in the Netherlands averaged 3.3% over the past five years, which means that bonds must yield at least 5.6% to preserve purchasing power for a private investor in the Netherlands. - European governments are grappling with a massive debt burden
Including pension obligations, the total debt burden in many cases exceeds 200% of GDP. Moreover, due to the aging population, it is becoming increasingly difficult to finance the welfare state, and the likelihood of a European credit crisis will only increase. In our view, high inflation ultimately remains one of the few ways to keep the debt burden and financing costs manageable. As a result, we consider real bond yields to be too low relative to future inflation expectations, which we believe will rise again.
We have also been pointing out for some time that the European energy transition will bring significantgreenflation. In the coming years, higher costs for grid connections and electricity will increasingly be passed on to European citizens, leading to new inflationary shocks. It is not only European industry that is suffering from high energy prices; ultimately, consumers will also be affected. While companies can still relocate their production to the US or Asia, citizens have little opportunity to move to fiscally and economically more attractive regions such as Switzerland, Monaco, or Dubai. When they go to the polls, as recently in the UK, dissatisfaction with high inflation becomes apparent. However, this does not automatically lead to policy changes. Starmer and the Labour Party suffered the biggest election defeat ever in the UK, which led to a sharp rise in interest rates in the UK.
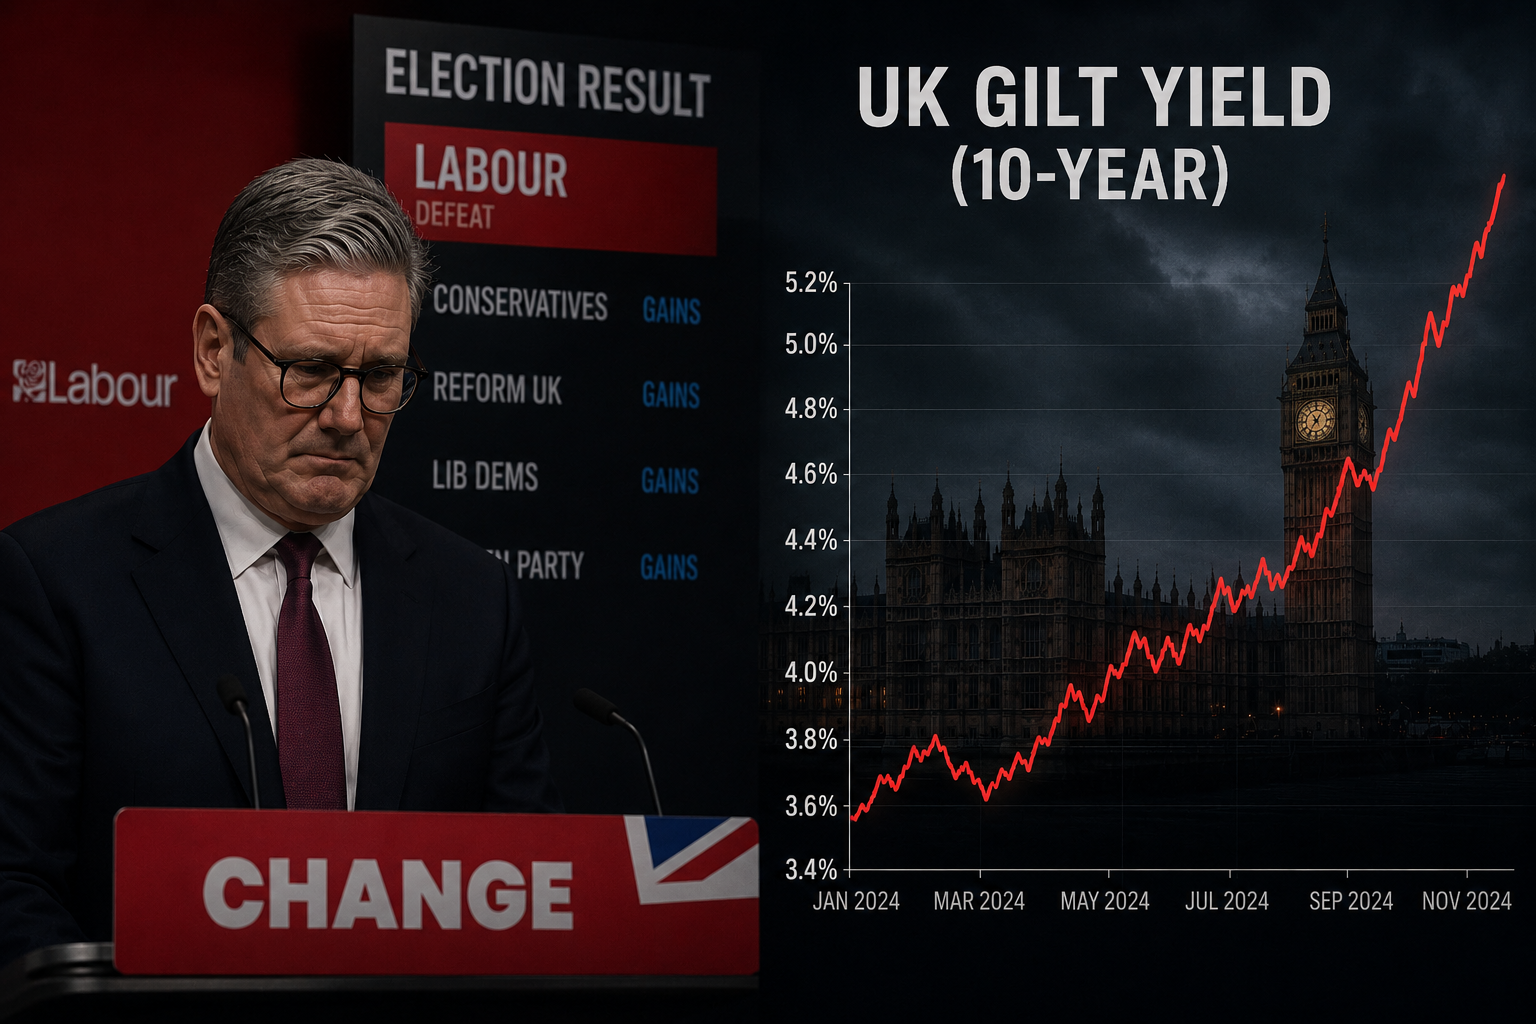
- In our view, bonds offer less and less protection when equity markets correct
Due to low starting yields and the lack of steep yield curves, the traditional diversification function of bonds has diminished. Rather than providing protection, losses on bonds—as was evident in 2022—can actually contribute to broader turmoil in the equity markets. Currently, we are seeing long-term interest rates reach critical levels in the UK and Japan, as well as in Germany and the US. By this, we mean that rising risk premiums on long-term bonds are having a negative impact on lending and, consequently, on the economies of the countries in question. Rising interest rates, combined with high government debt, are also likely to trigger another stock market crisis.
With regard to the third point, the article “A Positive Stock-Bond Correlation Is a Terrible Reason to Add More Equity Risk to Your Portfolio” by Cliff Asness, Daniel Villalon, and Antti Ilmanen (April 8, 2026) offers an interesting and nuanced counterargument to the popular claim that bonds have lost their value as a diversification tool.
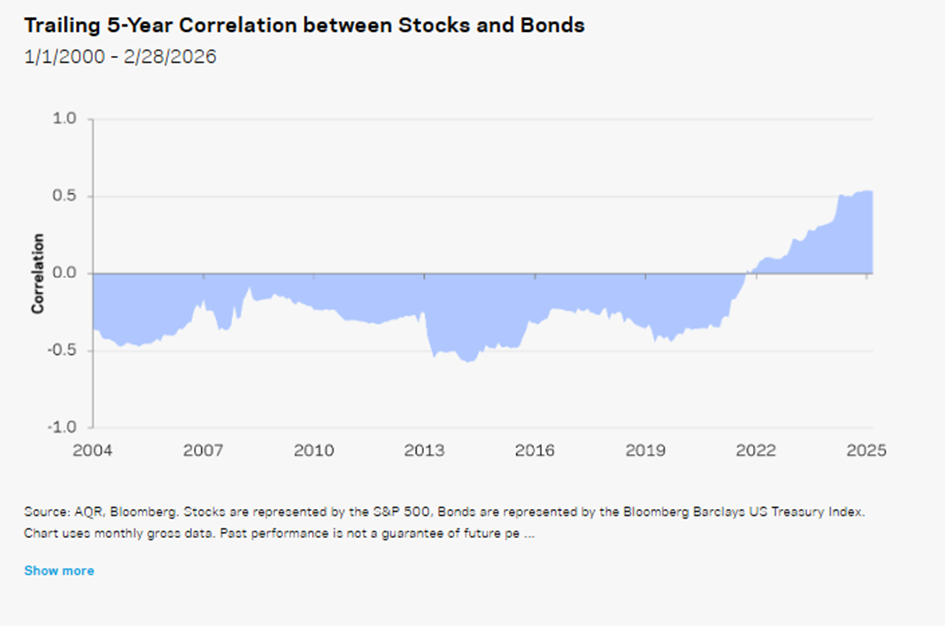
The central argument of the article is that many investors are drawing the wrong conclusion from the recent positive correlation between stocks and bonds. The prevailing view in the market is often as follows:
- Stocks and bonds are increasingly moving in the same direction (highly correlated);
- As a result, bonds are less effective at diversifying;
- Bonds are therefore no longer fulfilling their role;
- That is why bonds should be replaced with alternative assets or additional equity exposure.
According to AQR, it is precisely that last step that is problematic. AQR Capital Management is one of the largest quantitative asset managers in the world, with approximately $190 billion under management. The firm was founded by Cliff Asness and colleagues from the University of Chicago tradition and combines academically grounded research with systematic investment models. Its core view is that markets are not fully efficient and that factors offer structural risk premiums over the long term. The firm specializes in absolute return and factor strategies, including market neutral, managed futures, and style premiums, and is considered a pioneer in factor investing (value, momentum, quality, carry, and trend following).
The authors argue that many of the “alternatives” currently being promoted—such as private credit, buffer funds, and even Bitcoin—actually have a much higher implied equity exposure (equity beta) than investors realize. By reducing the weighting of bonds, portfolios appear to be better diversified, when in reality they become even more dependent on the direction of the stock market.
Their main point is that one should not focus solely on correlations, but rather on the underlying risk exposure. An asset class may have a different name or structure, but it can still be heavily dependent on the same economic factor: rising stock markets. In that regard, they argue that many alternative investments areessentially disguised equity beta. As long as stock markets rise, alternatives will rise along with them due to their high beta, but what if stock markets correct downward? In such a scenario, the total mix is even riskier than the 60/40 asset mix.
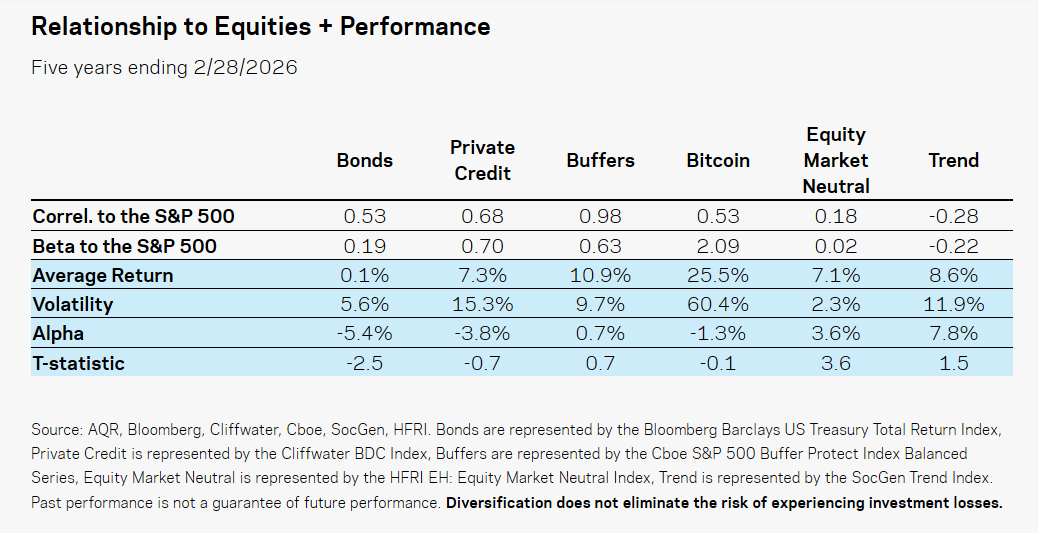
Interestingly, AQR does not deny the problem with the 60/40 portfolio. They explicitly acknowledge that the diversifying effect of bonds has weakened in an inflationary environment. Anyone looking at the table might conclude that private credit, buffers (stocks + options), and bitcoin are good substitutes for bonds due to their high returns. However, their advice is not to take on more equity risk, but to seek out assets and strategies with a truly low or even negative correlation to stock markets. In doing so, they primarily highlight two alternative strategies:
- Equity Market Neutral Strategies
Long/short equity strategies that largely neutralize market beta and seek to generate returns from relative valuation differences between stocks. - Trend-following / managed futures
Systematic strategies that capitalize on price and momentum trends in stocks, bonds, currencies, and commodities, and have historically performed well during periods of crisis or strong market trends.
According to AQR, these strategies in particular offer much better diversification than alternatives such as private credit or crypto, because their equity beta has historically been very low or even negative. Trend following stands out in particular, as it often generates positive returns in crisis scenarios when traditional assets are under pressure.
Tresor is also seeking diversification through absolute return strategies
It will come as no surprise that, since 2025, we have added several long/short equity managers, absolute return funds, and volatility managers to our strategic mix. We would, however, like to note that even the AQR approach cannot be applied blindly. Systematic strategies underperformed during the so-called“quant winter,” the period between 2018 and 2020, during which systematic and factor-based hedge funds and quant strategies underperformed for an extended period. When selecting absolute return strategies, we will therefore need to consider capacity, costs, and the shift from equity beta to factor beta. In addition, we will continue to include alternatives such as gold and real estate in the model portfolios.
Receive weekly insights in your inbox
Exclusive analyses and updates on family holdings and global market developments.
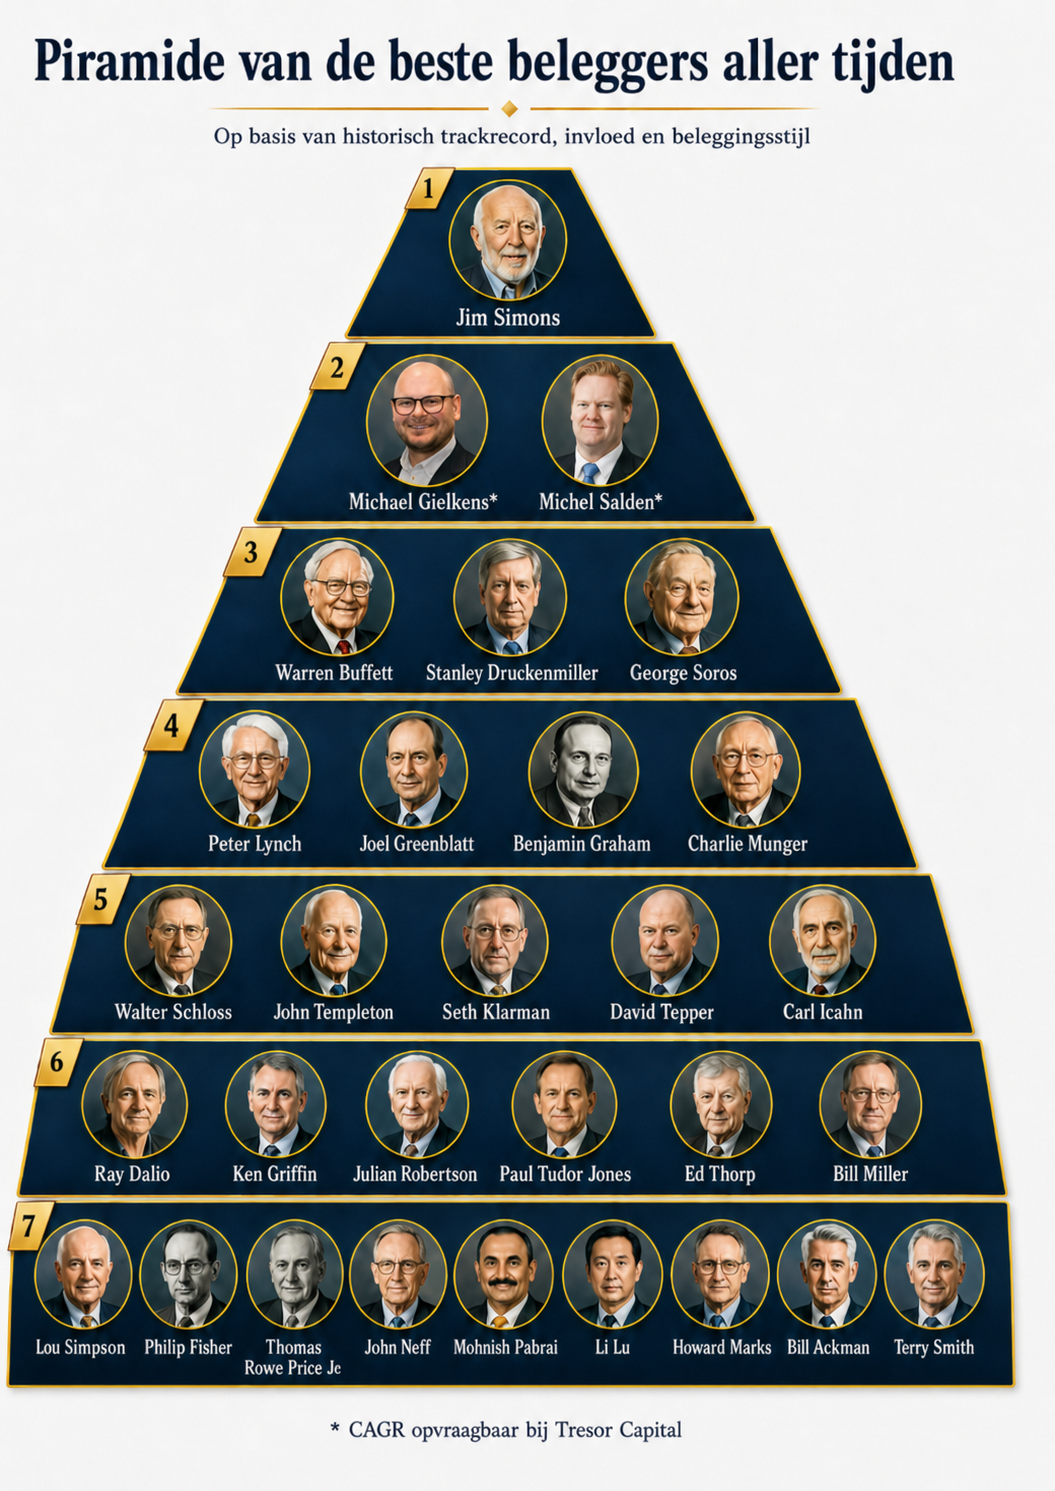
Dear Investors of All Time
A list of the greatest investors of all time has been circulating on social media this week. It was immediately clear that there was an AI error in it. Naturally, we had ChatGPT correct it (we saw the humor in the Twitter account’s post; hopefully you’ll understand our changes too 😉).
| Investor | Track record / period | Style & Notes |
|---|---|---|
| Jim Simons | Medallion Fund, 1988–2018. CAGR ±39% net. | Quant / statistical arbitrage. Probably the strongest track record ever, with extremely high returns and low correlation. |
| Warren Buffett | Berkshire Hathaway, 1965–2024. CAGR 19.9%. | Quality value / capital allocation. The best public compounder on a large scale and over a very long period. |
| Stanley Druckenmiller | Duquesne, 1981–2010. CAGR ±30%. | Global macro. A unique combination of returns, flexibility, and risk management. |
| George Soros | Quantum Fund, ca. 1969–2000. CAGR ±30%. | Global macro / reflexivity. Known for large asymmetric macro positions. |
| Peter Lynch | Fidelity Magellan, 1977–1990. CAGR 29.2%. | GARP / growth. One of the best mutual fund runs ever. |
| Joel Greenblatt | Gotham Capital, 1985–1994. CAGR ±30–50%. | Special situations / value. Specializes in spin-offs, restructurings, and event-driven value. |
| Benjamin Graham | Graham-Newman, 1936–1956. CAGR ±20%. | Deep value / net-nets. Founder of value investing and the margin of safety. |
| Charlie Munger | Wheeler Munger, 1962–1975. CAGR ±19.8%. | Concentrated quality. Crucial in the shift toward quality compounding. |
| Walter Schloss | WJS Partnership, 1955–2000. CAGR ±15%. | Classic Graham value. Discipline, simplicity, low costs, and a long-term perspective. |
| John Templeton | Templeton Growth, 1954–1992. CAGR ±14–16%. | Global contrarian value. A pioneer in international investing at low valuations. |
| Seth Klarman | Baupost Group, 1982–present. Historical CAGR of approximately 16–20%. | Distressed / value. Known for downside protection and cash discipline. |
| David Tepper | Appaloosa, 1993–present. Historical CAGR of approximately 25%. | Distressed credit / macro. Extremely strong in crisis and recovery situations. |
| Carl Icahn | Icahn Enterprises / activist investing. Indicative CAGR of approximately 15–20%. | Activist investing. Value creation through governance, break-ups, and corporate pressure. |
| Ray Dalio | Bridgewater, 1975–present. CAGR not clearly defined. | Global macro / risk parity. Has a major influence on institutional asset allocation strategies. |
| Ken Griffin | Citadel, 1990–present. CAGR not uniform across the public. | Multi-strategy hedge fund. Exceptional in terms of scale, systems, and risk management. |
| Julian Robertson | Tiger Management, 1980–2000. CAGR approximately 25–30%. | Long/short equity. Mentor to the Tiger Cubs; strong stock-picking with macro-driven strategies. |
| Paul Tudor Jones | Tudor, 1980s–present. Historical CAGR of approximately 20%. | Macro / trend following. Known for crisis alpha and trading discipline. |
| Ed Thorp | Princeton Newport / Ridgeline. CAGR ±15–20%. | Quant / arbitrage. Pioneer in options, convertibles, and statistical arbitrage. |
| Bill Miller | Legg Mason Value Trust, 1991–2005. CAGR ±15%+. | Contrarian value/growth. Outperformed the S&P 500 for fifteen consecutive years. |
| Lou Simpson | GEICO portfolio, 1979–2010. CAGR ±20%. | Concentrated quality value. Praised by Buffett as an exceptional investor. |
| Philip Fisher | Fisher & Co., long-term. CAGR not uniformly reported. | Growth quality. Significant influence on high-quality growth investments. |
| Thomas Rowe Price Jr. | T. Rowe Price, 1930s–1970s. CAGR not uniformly public. | Growth investing. One of the pioneers of professional growth investing. |
| John Neff | Windsor Fund, 1964–1995. CAGR ±13.7%. | Low P/E ratio. Strong long-term track record in mutual funds with a focus on valuation discipline. |
| Mohnish Pabrai | Pabrai Funds, 1999–present. High CAGR but volatile. | Cloning / value. Known for asymmetric value investing. |
| Li Lu | Himalaya Capital, 1997–present. CAGR not publicly disclosed. | Concentrated value. A strong focus on compounding, quality, and China. |
| Howard Marks | Oaktree, 1995–present. Credit returns, not pure equity CAGR. | Distressed debt/credit. Expert in economic cycles, risk assessment, and distressed credit. |
| Bill Ackman | Pershing Square, 2004–present. High CAGR but cyclical. | Activist / concentrated quality. Big winners, but also significant drawdowns. |
| Terry Smith | Fundsmith, 2010–present. Historical CAGR of approximately 15%. | Quality growth. “Buy good companies, don’t overpay, and do nothing.” |
| Michael Gielkens* | Tresor Capital. CAGR available upon request from Tresor Capital. | Performance and full track record available upon request from Tresor Capital. |
| Michel Salden* | Tresor Capital. CAGR available upon request from Tresor Capital. | Performance and full track record available upon request from Tresor Capital. |
* Michel Salden and Michael Gielkens, in true form, refrain from further comment and refer to the report by Tresor Capital. One practical limitation: the track record is not publicly available and can only be accessed with a minimum investment of €250,000. 😉
What do these investors have in common?
Our list of the top 30 best investors of all time pays tribute to visionary investors who have had a lasting impact on the financial markets. From value investing to macro strategies and quantitative models: each of them developed their own approach and achieved exceptional results over a long period. This list shows that successful investing isn’t just about having an information advantage or being able to predict the future perfectly, but rather about discipline, character, and controlling emotions. Warren Buffett is known for his patience and long-term vision, Charlie Munger for his rational thinking and multidisciplinary insights, Stanley Druckenmiller for his sharp macro vision and flexibility, and Jim Simons for his revolutionary data-driven and quantitative approach. Despite their differences, they share the same core qualities: discipline, independent thinking, and the ability to see opportunities where others see doubt.
Incidentally, the pyramid is explicitly intended to be indicative and lighthearted. As far as we’re concerned, Warren Buffett and Charlie Munger deserve the (shared) top spot just as much, especially when you consider how much value they have created over the decades. Moreover, investors’ track records are not directly comparable, as they were built over different periods, market conditions, cost structures, benchmarks, risk profiles, and scales. A return from the 1970s–1990s is difficult to compare with a return in today’s market, where information is available more quickly, competition is fiercer, and technology and data analysis play a much greater role. Furthermore, CAGR and alpha say little without context regarding leverage, liquidity, drawdowns, fees, concentration, and capacity. An exact ranking therefore remains, by definition, subjective. In other words: each of these figures offers ample material for further study, learning, and inspiration.
Learn more via the "
" podcast. At Tresor, we write about Buffett and Munger every week. Several investors from this pyramid have also been discussed in the highly informative podcast“Jong Beleggen,” in the series on great investors. As such, the podcast serves as a practical supplement to the pyramid: the episodes provide additional context regarding the investment philosophy, mindset, and strategy of these top investors.

The podcast has featured Warren Buffett, Charlie Munger, Peter Lynch, Nassim Nicholas Taleb, Terry Smith, Aswath Damodaran, Chuck Akre, Stanley Druckenmiller, Li Lu, Chris Hohn, Chris Mayer, François Rochon, and Sir John Templeton, among others. In addition, there is a broader episode on investment gurus that also discusses lessons from Howard Marks, Mohnish Pabrai, Joel Greenblatt, Nick Sleep, Tom Gayner, and Jean-Marie Eveillard, among others. These podcast episodes can be used to deepen your understanding of the pyramid. They demonstrate how various top investors think about valuation, risk, long-term returns, corporate quality, capital allocation, and behavioral psychology. As a result, the pyramid becomes not only an overview of well-known names but also a starting point for better understanding their investment principles.
Why are there no women in this pyramid?
The fact that there are no women in this pyramid does not mean that women are worse investors. On the contrary: several studies show that, on average, women are often actually strong investors. An analysis by Warwick Business School of 2,800 retail investors found that female investors outperformed male investors by an average of 1.8 percentage points over three years. A key explanation was that women, on average, invest less speculatively, trade less frequently, and more often adopt a long-term perspective. In an analysis of more than 5 million retail accounts covering 2011–2020, Fidelity found that women outperformed men by an average of 40 basis points per year.
It should be noted, however, that these studies may suffer from selection bias. Women who invest may not be a random reflection of all women, but likely a relatively financially savvy, interested, and possibly higher-educated subgroup, while a larger group within the male population is much more likely to open an investment account. Consequently, their better returns may stem in part from who is included in the sample, rather than from gender itself. Furthermore, an average difference says little about individuals. Even if women as a group perform slightly better, the variation within the groups is likely much greater than the average difference between men and women. So there may be many men who invest better than many women, and vice versa.

Nevertheless, the lack of women in the pyramid may be due more to historical visibility and access to the financial sector than to a difference in investment quality. The well-known “canon” of top investors was largely formed during a period when asset management, Wall Street, and fund management were heavily dominated by men. A clear example is Muriel Siebert: she became the first woman to hold a seat on the New York Stock Exchange in 1967 and was subsequently the only woman among 1,365 men on the trading floor for ten years. This imbalance is still evident today: Morningstar reported in 2024 that while women make up 44% of the asset management sector, the gap widens in senior leadership and investment roles. On average, women held only 18% of portfolio manager positions at the fund firms surveyed.
That is why it is more accurate to say that this pyramid primarily provides an overview of the most talked-about and historically prominent top investors, not necessarily of all the best investors. A future version of the pyramid would be stronger and more balanced by also including female investors and financial pioneers, such as Geraldine Weiss, Hetty Green, Muriel Siebert, or Leda Braga. This would not only make the pyramid more complete, but also more representative of the reality that good investing is not a matter of gender, but primarily revolves around discipline, risk management, patience, and rational decision-making.
| Name | Active period | Return / CAGR | Note |
|---|---|---|---|
| Geraldine Weiss | 1966–2002: Worked at Investment Quality Trends | Model portfolio since 1985: return of 11.37× vs. the Wilshire 5000’s 11.26×; 10-year average: 12.20% per year | Data is a newsletter/model portfolio, not a fund account. |
| Hetty Green | c. 1865–1916 | Rough CAGR: approx. 4.6%–6.1% per year, depending on initial capital of $5–10 million growing to over $100 million | Estimate based on asset growth; not a modern performance audit. |
| Muriel Siebert | 1950s–2013 | No meaningful CAGR is available | This is particularly important in her capacity as a broker, entrepreneur, and the first woman to hold a seat on the NYSE—not as a public investor with a track record. |
| Leda Braga | BlueTrend since 2004; Systematica since 2015 | BlueTrend 2004–2014: over 11% per year; 2019: +13.6%; in 2025, a temporary -18.8% year-to-date and nearly -36% from the 2022 peak | Hedge fund data is fragmented and often not fully verifiable by the public. |
| Cathie Wood | ARK founded in 2014; ARKK launched in November 2014 | ARKK Nov. 2014–Apr. 2026: 13.12% per year, maximum drawdown approx. -77%; inflation-adjusted 9.85% per year | Highly cyclical: strong in 2020, sharp decline in 2021–2022. |
Needless to say, it makes no difference to us whether men or women perform better. As true meritocrats and fully rational investors, we select candidates based solely on quality, discipline, integrity, and long-term performance. This applies both to the selection of external fund managers and to the composition of management teams within our holding companies. Gender is not a criterion in this regard; demonstrable competence and allocation skills are.
Receive weekly insights in your inbox
Exclusive analyses and updates on family holdings and global market developments.
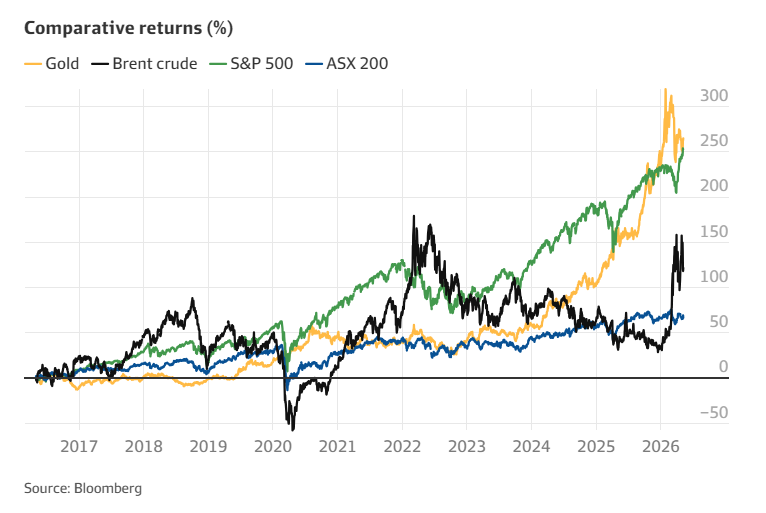
Gold is supposed to be a safe haven. So why isn’t it behaving that way?
Since the outbreak of the Iran-U.S. conflict in late February, gold prices have actually fallen, despite the geopolitical tensions. According to the market experts cited, this is because, in times of crisis, gold is sometimes not bought as a safe haven but is instead sold to raise cash.
Gold is being sold to free up dollars
An article on afr.com provides the key explanation: gold is extremely liquid. When markets experience shocks, investors, countries, or institutions sometimes need to quickly free up dollars. In such cases, they sell gold not because they have lost confidence in it, but because it is one of the easiest assets to liquidate. This also happened around the time of the Lehman Brothers collapse and at the start of the COVID-19 crisis.
A second explanation is macroeconomic. The energy crisis and war are disrupting revenue streams, particularly for countries that depend on oil and gas exports. This creates demand for dollars. Gold then functions asa balance sheet asset: a reserve that can be liquidated to obtain dollar liquidity.
This leads to a nuanced conclusion: gold does not necessarily fail as a safe haven; rather, its use shifts temporarily. In times of acute stress, gold prices may fall due to forced selling, margin calls, or official sales. Only later, once liquidity pressures ease, can it resume its protective function.
’s Investment Implications For investors, the lesson is that gold is not an automatic hedge against every crisis scenario. It works better as a strategic long-term insurance policy than as a short-term instrument that always rises during times of war or panic. In periods of rising real interest rates, a strong dollar, or liquidity stress, gold can actually come under pressure. Morgan Stanley specifically points to higher real interest rate expectations and energy shocks as factors that could temporarily weaken gold’s safe-haven status. This therefore applies to a scenario following an inflation shock.
Since the great financial crisis, however, we have seen central banks cutting interest rates more quickly in order to support lending and overall market sentiment. Consequently, real interest rates are being artificially suppressed. Due to the negative correlation between (real) interest rates and gold, gold’s defensive nature comes to the fore. We therefore expect the gold price to resume its upward trend as soon as calm returns to the Strait of Hormuz, the dollar weakens, and pressure on the Gulf States to generate liquidity eases.

Receive weekly insights in your inbox
Exclusive analyses and updates on family holdings and global market developments.
Would you like more information about our services?
Contact usDisclaimer:
No rights can be derived from this publication. This is a publication by Tresor Capital. Reproduction of this document, or parts thereof, by third parties is only permitted with written permission and with reference to the source, Tresor Capital.
This publication has been compiled with the utmost care by Tresor Capital. The information is intended in a general sense and is not tailored to your individual situation. The information should therefore expressly not be regarded as advice, an offer or a proposal to purchase or trade investment products and/or purchase investment services, nor as investment advice. The authors, Tresor Capital and/or its employees may hold positions in the securities discussed, either for their own account or for their clients.
You should carefully consider the risks before you start investing. The value of your investments may fluctuate. Past performance is no guarantee of future results. You may lose (part of) your investment. Tresor Capital accepts no liability for any inaccuracies or omissions. This information is for indicative purposes only and is subject to change.
Read the full disclaimer at tresorcapitalnieuws.nl/disclaimer .