
Economy & Markets #32 – A hectic week on the stock market


This week's topics:
Trump gains broader support at the Fed
Shortly after our previous newsletter was sent (last Friday afternoon), unrest broke out during US trading hours. Adriana Kugler announced her immediate departure from the Fed, giving President Trump the chance to appoint a candidate favourable to him. With the (temporary) appointment of Stephen Miran, the balance of power within the Fed is shifting, together with the two existing dissenters, in favour of the pro-Trump camp – especially once Chair Jerome Powell also steps down next year. It will come as no surprise that Miran is known for supporting lower interest rates and for reforms within the Fed, such as shorter terms for board members. The pressure on Fed Chair Jerome Powell to already cut rates in September is certain to increase.
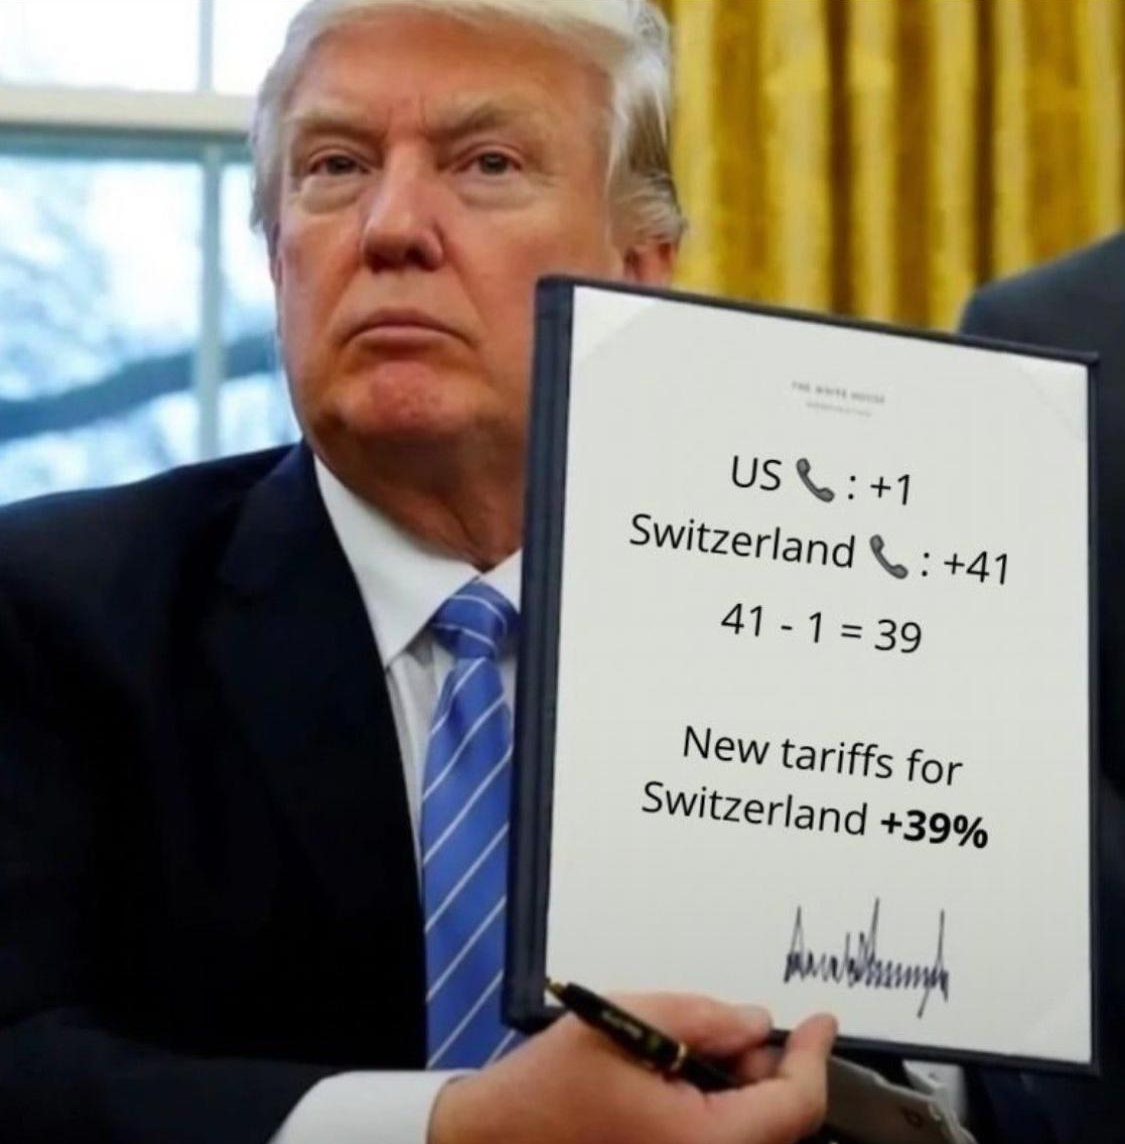
A second source of uncertainty is the unpredictability of Trump's trade policy. Last week he unexpectedly announced steep increases in import tariffs for several countries and sectors. Switzerland stands out in particular, facing a levy of 39% on certain export products. Swiss President Karin Keller-Sutter travelled to Washington with her delegation but returned without a deal: her proposal to lower the tariff to 10% was rejected. Note that Switzerland mainly sells high-value goods (technology, pharmaceuticals, watches and gold) in the US: even with high tariffs, production of Rolex watches is unlikely to move from the Jura to the fly-over states in the US any time soon.
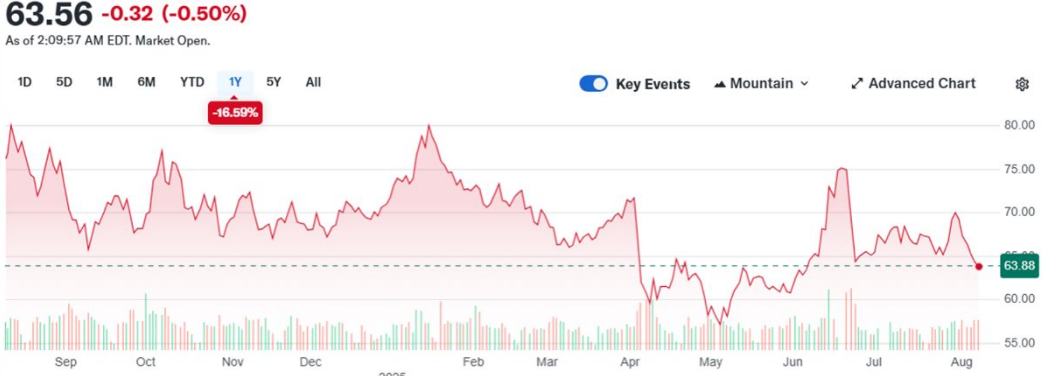
India, together with China one of the largest buyers of Russian oil, is also being hit hard by new tariffs. For India the measures are particularly sensitive: the country is a major supplier of pharmaceutical products to the US and is home to many production facilities of multinationals such as Apple (electronics, incidentally, fall outside the tariffs). Trade advantages can no longer be taken for granted, not even for traditional partners.
At the same time, OPEC unexpectedly announced a production increase over the same weekend: from September, an extra 547,000 barrels will be produced daily. That brings the total increase in 2025 to 2.5 million barrels per day. The aim seems clear: to keep both American and Indian consumers satisfied. Especially after the summer, when seasonal demand (the "driving season" in the northern hemisphere and peak air-conditioning use in the Middle East and Asia) tapers off, this could put additional downward pressure on the oil price.
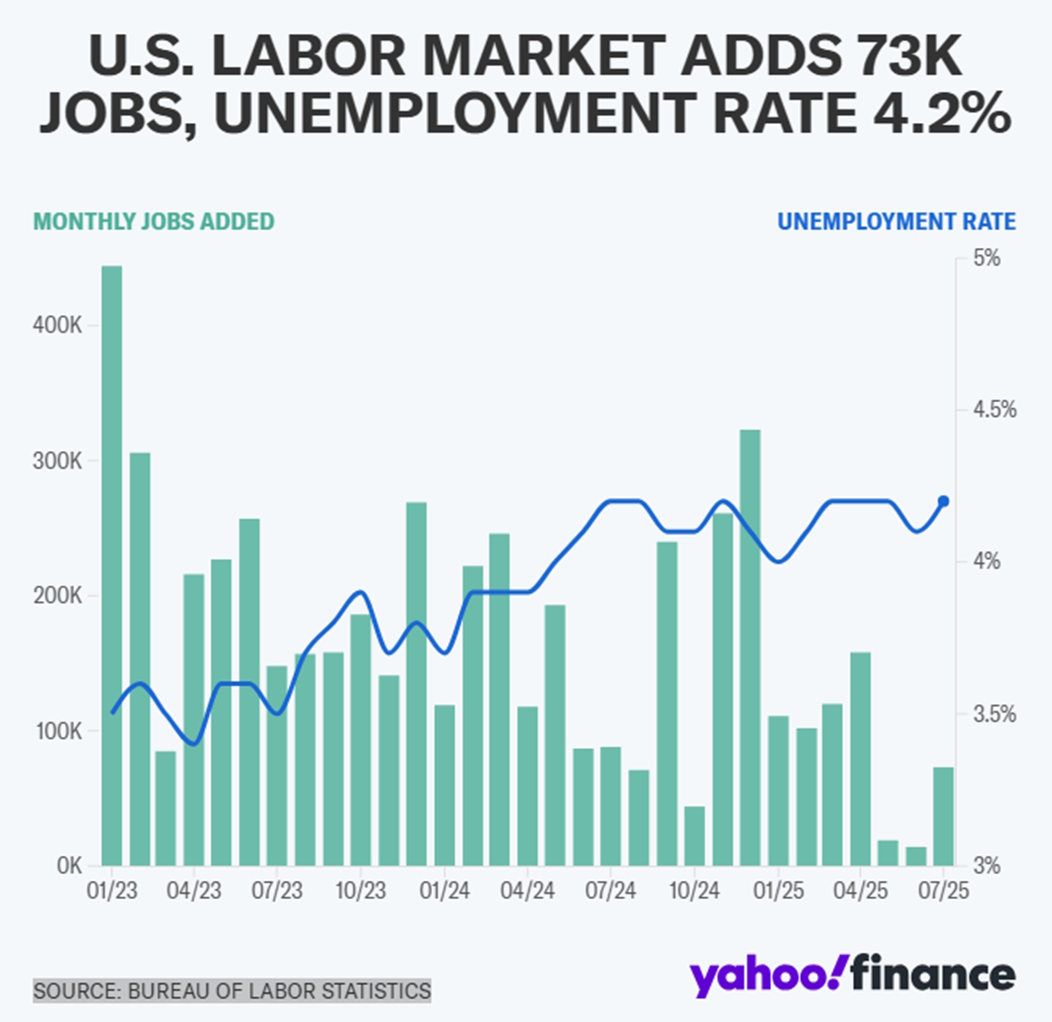
The third disruptive factor came on Friday afternoon from the July labour market report. Job growth fell well short of expectations: only 76,000 jobs were added, the smallest increase since November 2020. Moreover, the figures for May and June were revised sharply downward – from +115,000 to +12,000 and from +108,000 to +36,000 respectively – meaning that 175,000 fewer jobs were created over those two months combined than previously reported.
Unemployment rose slightly, from 4.1% to 4.2%, while the participation rate remained virtually unchanged at 62.4%. This is partly due to the halt in immigration and the deportation of foreign workers, combined with very limited growth in the domestic workforce. As a result, labour supply has come to a near standstill and wage pressure is increasing. Despite the disappointing employment figures, wage growth therefore remains robust: average hourly earnings rose by 0.4% m/m and 3.9% y/y in July.
Fed Chair Jerome Powell stressed this week that unemployment and wage developments are better indicators of the health of the labour market than the monthly jobs figure. Still, the revised figures suggest that economic growth is slowing, falling back to 1.25 to 1.75% year-on-year in the US, which keeps the Fed in a bind: slowing growth alongside rising inflation.
Uncertainty at top of labour statistics bureau after disappointing jobs data
Following the release of disappointing labour market figures, the head of the US Bureau of Labor Statistics (BLS) is under pressure. President Trump indicated that this top official, too, might be better off leaving, given the unwelcome reports. However, the independence of institutions such as the central bank and the labour statistics bureau is crucial for market confidence and sound economic decision-making.
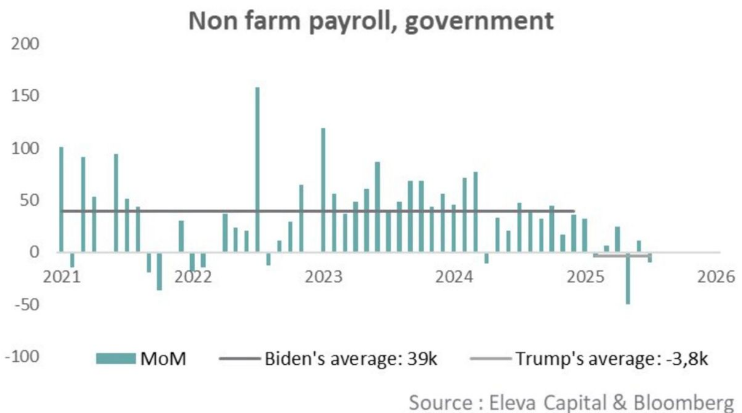
If political pressure becomes too intense, it can seriously undermine confidence. According to recent figures from Eleva Capital, a well-known investment boutique, around 275,000 federal jobs have disappeared since Trump took office. This fits within the conservative policy of Trump and the Republicans, who want to reduce the government deficit in order to give the economy and the business sector more room to grow.
Diametrically opposed developments in the role of government in the US and Europe: measured against the Laffer and Rahn Curves
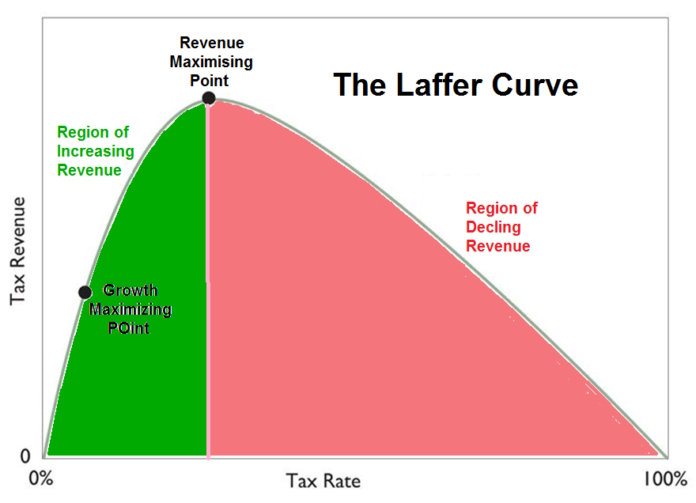
The economic policy paths of the United States and Europe are increasingly diverging, especially when viewed through the lens of the Laffer and Rahn Curves. While the US relies on incentives created by market mechanisms and the lowest possible taxes, Europe continues to build on solidarity and collective provisions.
Nevertheless, government debt is rising rapidly in both Europe and the US. At the same time, the population in both regions is ageing, which increases pressure on social provisions and pension systems. In addition, the structure of the services sector and manufacturing industry is changing dramatically, partly due to increasing globalisation and competition, especially from countries such as China. This combination of demographic and economic factors presents governments with major challenges in the areas of fiscal management, growth and innovation.
As long-term allocators, it is crucial to look at which structure and which economic model is chosen in different regions. After all, this determines the sustainable growth outlook, the risk profile and the impact of policy on returns. The diametrically opposed development between the US and Europe, viewed through the lens of the Laffer and Rahn Curves, illustrates how divergent choices regarding tax burden, the size of government and social provisions lead to different economic dynamics and, with them, different investment opportunities.
US: market-oriented vision and lower tax burden
A market-oriented vision dominates in the US. Lower taxes for companies and wealthy individuals and less government spending are seen as the best recipe for economic growth. This approach draws heavily on the Laffer Curve, based on the idea that tax cuts ultimately lead to more economic activity, higher investment and – over time – higher net revenues for the government.
- The effective corporate tax rate in the US fell from 35% to 21% as a result of the 2017 reform, which led to a boost in corporate investment, although the long-term effects remain a subject of debate.
- For individuals, the top marginal income tax rate has stood at around 37% since the reform (for the highest income groups). In addition, the social security contribution burden is relatively low compared with Europe.
- The sales tax rate in the US ranges between 6-9%.
- According to the Congressional Budget Office (CBO), government spending as a percentage of GDP fell from around 38% in 2010 to approximately 31% in 2024, partly due to cuts in federal jobs and social programmes.
- The US government apparatus is relatively small: in 2023, the total number of federal jobs stood at around 2 million. By comparison, the European public sector is on average much larger, even when accounting for population size.
Europe: higher tax burden and a larger role for government
Europe takes a virtually opposite course. It pursues a higher tax burden and more extensive government spending, with the emphasis on providing public goods such as education, infrastructure and social security.
- The average tax burden in the European Union stands at around 40-45% of GDP (OECD, 2024), considerably higher than the roughly 26% in the US.
- The effective corporate tax rate varies widely across Europe, but averages around 25%. Some countries (such as France and Germany) have rates of around 30-33%.
- Marginal income tax rates for the highest income groups range between 45% and 55% in many European countries, plus a high social security contribution burden, which significantly increases the total tax burden on labour.
- VAT in Europe ranges between 17% and 27%.
- Government spending in many European countries amounts to between 45% and 55% of GDP, with countries such as France, Sweden and Denmark even exceeding 50%.
- Social programmes and public sector jobs are relatively extensive: in Germany, more than 4 million people work for the government, proportionally far more than in the US.
A brief introduction to the Rahn Curve: the tension between size and efficiency
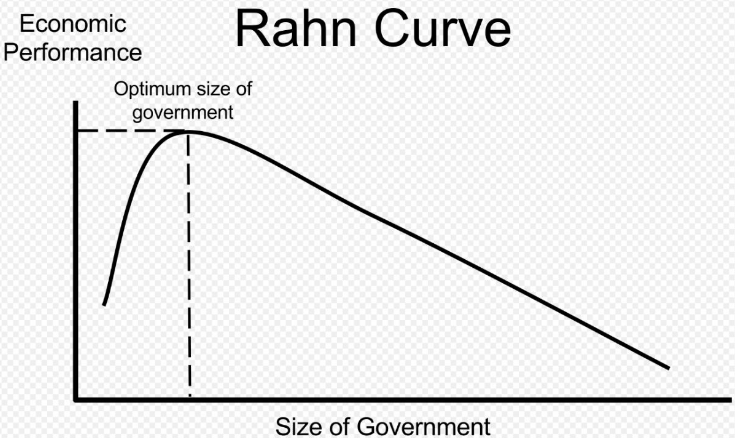
The Rahn Curve is an economic model named after Richard W. Rahn, an American economist and policy adviser. He introduced this concept in the 1990s to illustrate that – just as with the Laffer Curve for taxes – there is an optimal level of government spending that maximises economic growth.
- Insufficient government investment in, for example, infrastructure, education and innovation can seriously hamper growth in the longer term. Without sufficient public funding for these essential functions, the productivity and competitiveness of the economy can decline.
- Conversely, a government that is too large, characterised by inefficiency, bureaucratic red tape and excessive social spending, can also stifle economic dynamism. This can lead to a higher tax burden, reduced incentives for entrepreneurship and lower private-sector investment.
In the United States, cutting government jobs and government spending has long been seen as a stimulus for economic growth, on the assumption that a smaller government creates room for innovation and private investment. However, this approach risks putting pressure on essential investments in public infrastructure and social provisions, which could hamper productivity growth in the long run. Moreover, the tension between stimulating growth and safeguarding social stability remains.
In Europe, by contrast, investment is being directed towards public goods in order to safeguard social and economic sustainability. This results in a larger role for government and higher direct burdens (taxes and contributions), which can dampen growth in the short term. Even so, this is regarded as a deliberate choice to preserve inclusiveness, social cohesion and broad-based prosperity. The challenge lies in avoiding inefficiencies and ensuring a government that stimulates innovation and productivity without placing too heavy a burden on businesses and workers.
In short, the Rahn Curve highlights the delicate balance between the size of government and the efficiency of the economy, where both too little and too much government involvement can be damaging. Practice in the US and Europe shows different emphases and challenges within this tension.
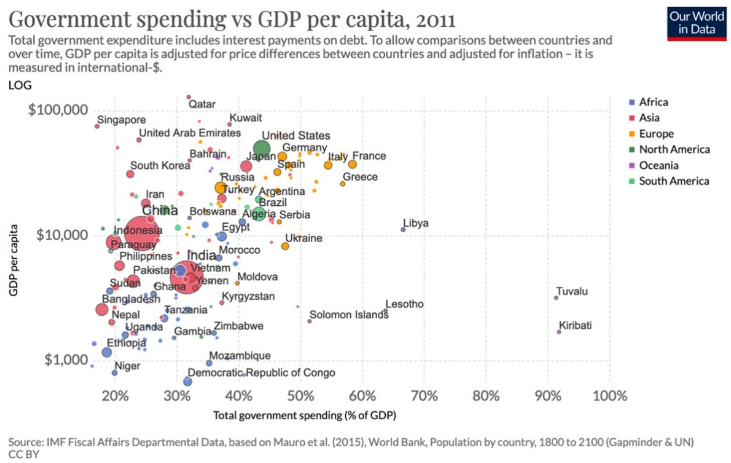
Unfortunately, there are few recent, up-to-date depictions of the Rahn Curve available. The image below (from 2011) is outdated and does not reflect developments of the past 15 years, such as the strong growth in GDP per capita in the United States (US exceptionalism) versus stagnation in Europe. We therefore welcome any new, updated versions that better illustrate these trends.
Sell in May and come back in September (or October)
At Tresor Capital we don't engage in market timing, but the "Sell in May" phenomenon remains a popular topic that keeps returning in the media. Interestingly, it is precisely the summer months in the US that have historically performed well (S&P 500 data from 1950 to the present):
- May average +0.3%
- June average +0.1%
- July average +1.3%
September, by contrast, is traditionally the worst month, with an average negative return of around –0.7%. Why September? Although September is not a typical holiday period, it often marks the end of the relatively quiet summer. Investors tend to take profits during this month, just as important quarterly results start coming in. This generally leads to more volatility and downward pressure on the markets.
Strong earnings season in the US
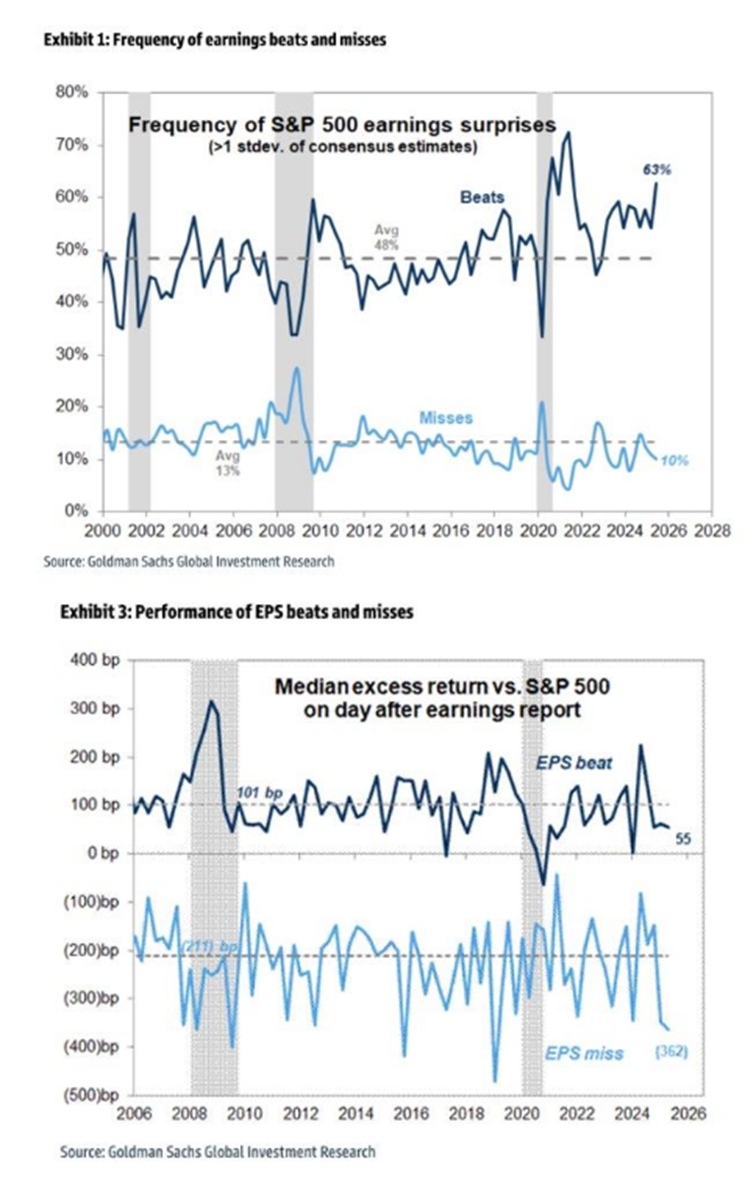
The second-quarter reporting season in the United States is once again showing a remarkably strong performance. Around 82% of S&P 500 companies beat earnings expectations, and 79% exceeded expectations on revenue. Blended year-on-year earnings growth stands at a solid 10.3%, the third consecutive period with double-digit growth figures. The technology sector, financial services and consumer goods are particularly driving these strong results. Major tech players such as Microsoft and Meta are excelling, partly thanks to breakthroughs in AI and rising revenues from data centres, cloud and AI applications.
Mixed picture in Europe
In Europe, the picture is more mixed. The Stoxx Europe 600 index shows little to no overall earnings growth, and around half of companies are beating expectations. Factors such as a strong euro and trade barriers are weighing on the profitability of European exporters. Still, some sectors, such as banks and defence, are showing resilience thanks to higher interest rates and government investment. According to recent analyses, earnings are growing at many European companies, but this growth is less pronounced than in the US.
The US equity market typically trades at higher valuations than the European market, partly because of the larger share of technology and growth companies with high expected future earnings. This means the US market can be more sensitive to disappointments or earnings corrections, which can amplify volatility.
However, this strong underlying trend goes hand in hand with significant share price swings. We often see sizeable downward corrections if results come in even slightly below expectations, while good results and positive guidance are barely followed by substantial share price gains. Europe, by contrast, has lower valuations and more cyclical sectors, resulting in less optimistic expectations but potentially also a more defensive position in uncertain markets.
Receive weekly insights in your inbox
Exclusive analyses and updates on family holding companies and global market developments.
Would you like more information about our services? Please feel free to get in touch.
Get in touch
Disclaimer:
No rights can be derived from this publication. This is a publication of Tresor Capital. Reproduction of this document, or parts thereof, by third parties is only permitted with written consent and with reference to the source, Tresor Capital.
This publication has been compiled by Tresor Capital with the utmost care. The information is intended in a general sense and is not tailored to your individual situation. The information must therefore explicitly not be regarded as advice, an offer or a proposal to purchase or trade investment products and/or to use investment services, nor as investment advice. The authors, Tresor Capital and/or its employees may hold positions in the securities discussed, for their own account or for their clients.
You should carefully consider the risks before you start investing. The value of your investments may fluctuate. Past performance offers no guarantee for the future. You may lose (part of) your capital invested. Tresor Capital disclaims any form of liability for any inaccuracies or errors. This information is purely indicative and subject to change.
Read the full disclaimer at tresorcapitalnieuws.nl/disclaimer .
This article was originally written in Dutch and automatically translated into English with the help of AI. In case of any difference, the Dutch original prevails.