
Economy & Markets #40 - Is the Netherlands heading down the French road?

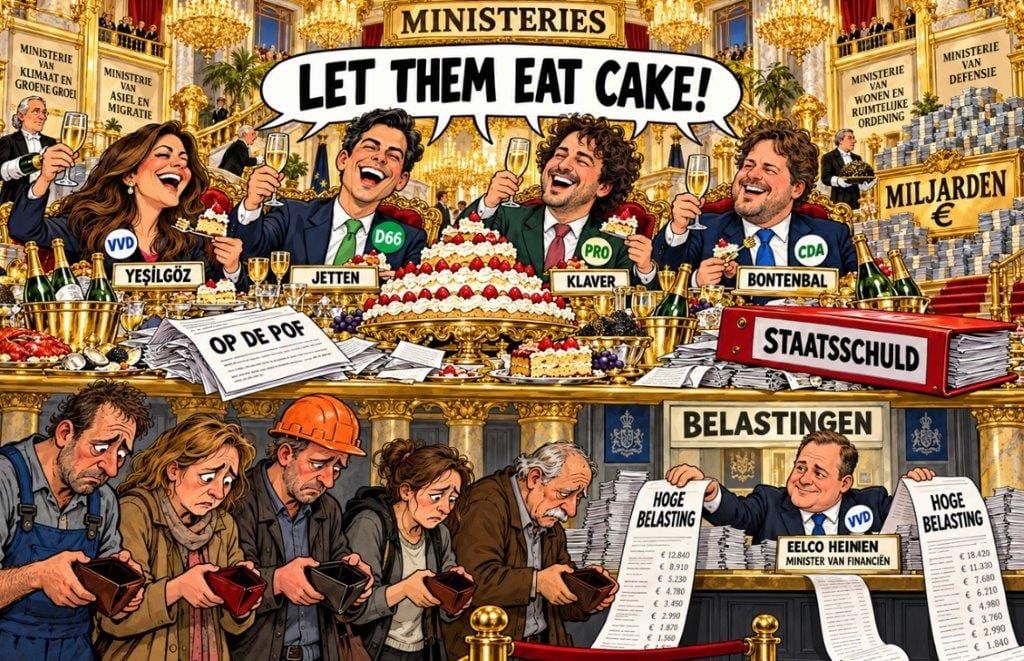
Box 3 (Dutch wealth tax) overhauled: tax deferral for investors, a higher bill for savers and majority shareholders (dga's)
After much international criticism, the government is abandoning an annual tax on unrealised capital gains on most investments. From 2028, a capital gains tax will apply to financial instruments such as shares, bonds and options. Profits will only be taxed once they are actually realised, for example upon a sale or distribution. Interest and dividends will, in principle, continue to be taxed annually.
Around ninety percent of assets with value development will fall under this new regime from 2028. For other asset components, the transition is planned for 2030. The change offers investors a financial deferral, but does not necessarily reduce the overall tax burden. To compensate for this deferral, the exemptions will be lowered, the deemed return will rise in 2027 and the rules for loans from one's own private limited company will be tightened.
The bill already starts in 2027
To help finance the transition to the new wealth tax, the government plans to significantly tighten the box 3 levy in the short term. This means that the tax-free allowance will fall sharply in 2027, from €59,357 to €30,846 per person. For tax partners, the exemption will thus be more than halved, from €118,714 to €61,692.
In addition, the government wants to raise the deemed return on other assets by 1.5 percentage points, increasing it from 6.37% to 7.87%. This increased notional return applies, among other things, to investments and real estate, while a separate, lower category will continue to apply to savings.
With the introduction of the new system in 2028, the overall wealth exemption will be abolished entirely. In its place, the government is introducing a tax-free result of €1,800 per person. Under this approach, it is no longer the total accumulated wealth that is exempted, but only the actual return achieved. Assuming a savings interest rate of 2.5%, this €1,800 threshold on interest translates into an exempt savings amount of around €72,000. For the average saver, however, this new setup brings hardly any relief, since all interest received will, in principle, remain taxable annually. In fact, because the overall exemptions are being reduced so drastically, more small savers are likely to become liable for tax in the short term.
A higher levy on realised gains?
An investor with a securities portfolio of €1 million realises a capital gain of €200,000 in a single year. How does the box 3 tax burden work out under the current transitional regime versus the government's plans?
| 2026 | 2027 | 2028 | |
|---|---|---|---|
| Exemption | €59,357 assets |
€30,846 assets |
€1,000 return |
| Taxable return | approximately €56,439 | approximately €76,272 | €199,000 |
| Box 3 levy (36%) | approximately €20,318 | approximately €27,458 | €71,640 |
Source: Tresor Capital.
In 2026 you start with assets worth €1,000,000, from which the asset exemption of €59,357 is deducted. This gives a taxable base of €940,643. The Dutch Tax Authority multiplies this amount by a deemed return of 6.04%, which works out to approximately €56,439 in taxable return. You pay 36% tax on this deemed return, resulting in a levy of approximately €20,318. The actual capital gain realised plays no role whatsoever in this year.
In the transitional year 2027, total assets remain at €1,000,000, but the exemption drops to €30,846. As a result, the taxable base rises to €969,154. Because the government raises the deemed return rate to 7.87%, the taxable return comes to approximately €76,272. At the 36% tax rate, the final levy rises to approximately €27,458, an increase of more than 35% compared with 2026.
From 2028 the asset exemption lapses and a tax-free allowance of €1,000 applies to the profit. If the portfolio is sold with a capital gain of €200,000, €199,000 in taxable return remains after deducting this exemption. You pay 36% tax on this actually realised gain, meaning the total assessment peaks in one go at €71,640. In short, the move to the capital gains tax regime brings about a major shift.
DGAs: less room to borrow from their own bv
Besides the changes for private investors and savers in box 3, the new tax package also affects directeuren-grootaandeelhouders (dgas, director-major shareholders). A dga is an entrepreneur who holds a substantial interest in their own besloten vennootschap (bv, private limited company) and is employed there as director. Many dgas borrow money from their own company for private expenses or investments. From 2027, the cabinet wants to gradually lower the maximum limit for this: from €500,000 to €420,000 in 2027, and eventually to €100,000 in 2031.
If, for example, a dga has a loan of €450,000 in 2027, this exceeds the new statutory limit by €30,000. That excess amount is then taxed in box 2 as if it were a distributed dividend. At the lower box 2 rate, this costs approximately €7,350 in tax (€30,000 × 24.5%), assuming the dga has no other box 2 income that year. The loan itself simply continues to exist. It is important to know that mortgage loans for one's own home fall outside this scheme under certain conditions.
To accommodate dgas, the cabinet wants to temporarily lower the higher box 2 rate from 31% to 29.2% for the period from 2027 through 2030. This makes paying out dividend to repay an excessive loan temporarily cheaper, but the stricter borrowing limit remains fully in force. This can create financial pressure when a dga has borrowed the maximum amount and has tied this money up in less liquid investments.
The proposed changes must be approved by parliament via a supplementary bill (a novelle). The cabinet aims to have the entire package passed by the Eerste Kamer (Senate) before 31 December 2026. The Tweede Kamer (House of Representatives) had already approved the Wet werkelijk rendement box 3 (Actual Return Box 3 Act) bill earlier, but the Eerste Kamer postponed the final vote pending these new amendments.
Besides the political decision-making process, practical implementation also poses a major challenge. For the new system, the Dutch Tax Authority needs detailed data on historical purchase prices and sales. Reporting on the letter to parliament shows that in the first year, banks will probably not yet be able to supply all the required information in time for the pre-filled tax return.
The accumulation of all these fiscal measures is leading to growing incomprehension among entrepreneurs and investors. Tech entrepreneur Jitse Groen recently voiced the growing frustration over the pile-up of rules and levies sharply on X:
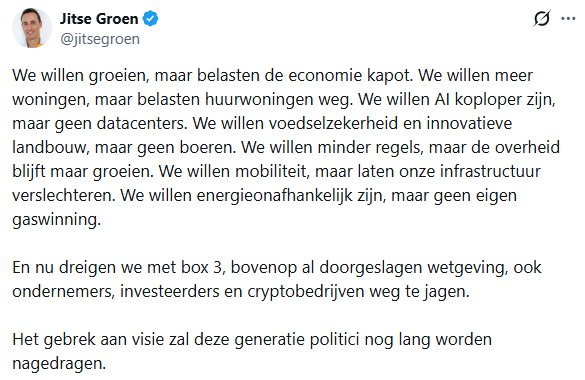
His outburst underscores the broader sentiment in the business community: on the one hand, the cabinet is calling for private investment and economic growth, but on the other, it keeps making this harder through continuous legislative changes and a higher tax burden on accumulated wealth.
The Netherlands is turning French: an expanding government and cross-border effects
Jitse Groen's remark about a government that is squeezing the economy does not stand on its own. The Netherlands is in fact starting to resemble France in a striking way: a country with high taxes, a rapidly expanding civil service and a structural lack of focus on economic growth and competitiveness. Although the cabinet is announcing major savings, a convincing plan to actually keep government spending under control is missing. Politically sensitive items, such as social schemes, the energy transition and development aid, remain largely untouched.
The fact that this rising government spending is being recouped from citizens through a higher tax burden does not automatically bring in more money for the treasury. Figures from CBS (the Dutch national statistics office) show that the Dutch are crossing the border en masse to avoid the high costs. In the first half of 2026, payments at foreign petrol stations rose by 20%, and the number of shopping trips to Belgian and German supermarkets also increased visibly.
If the tax burden remains persistently high, some entrepreneurs and pensioners may once again dust off their Ik Vertrek ("I'm Leaving") plans.

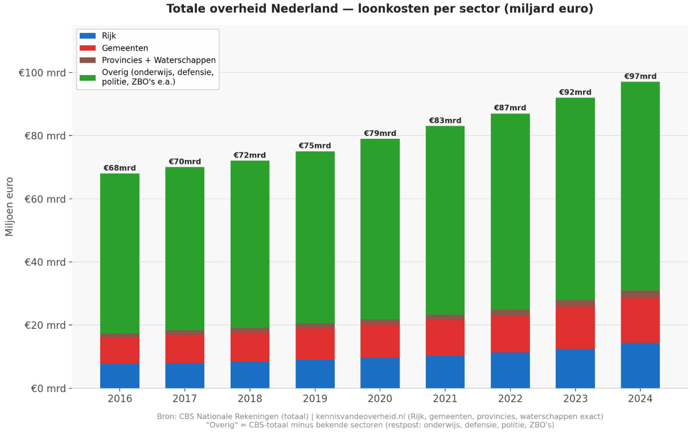
Meanwhile, the civil service keeps steadily growing. In 2025, central government counted more than 160,000 full-time jobs, a rise of 1.9% compared with a year earlier. Looking over a longer period, the picture is even more striking: between 2015 and 2024, central government staffing grew by almost 48,000 full-time jobs, while staffing at municipalities rose by as much as 34.6%. Across the public sector as a whole, more than 110,000 full-time jobs were added, while wage costs and overhead per employee also rose sharply. France is showing this week where that course leads if a country sticks to it for years on end.
Is France heading for a new debt crisis?
France is increasingly displaying the characteristics of a country where investors are losing confidence in budgetary discipline. Rising interest rates, political paralysis and social unrest are reinforcing one another, threatening a downward spiral that is becoming ever harder to curb. A financial and social crisis is conceivable, but France is not (yet) an emerging market, and an acute banking crisis is not an obvious prospect.
| Indicator | France | Explanation |
|---|---|---|
| Government debt | 119% of GDP (€3,596 billion, Jun '26) | End 2025: 115.6% |
| Budget deficit | 5.1% of GDP (2025) | 2026: approx. 5.4%; 2027 target: 5% |
| Interest expenses | approx. €65 billion (2026) | Potentially €91 billion in 2027 |
| Pension expenditure | 14.1% of GDP (approx. €422 billion, 2025) | 2027 estimate: approx. €436 billion |
| Economic growth | +0.9% (2025) | 2026 forecast: approx. +0.4% |
| Unemployment | 8.3% (Q2 2026) | Highest level since 2020 |
| GDP per capita | 98% of EU average | Measured in purchasing power |
Source: INSEE, Banque de France, French government.
The bond market pulls the emergency brake
French government debt is rising and the budget deficit remains high. For 2027, the government has announced €54 billion in savings and tax measures, aiming to bring the deficit down to 5% of GDP. Investors are doubtful whether that plan is achievable. According to recent projections, debt could rise further, above 120% of GDP.
how far can the spread rise. (the difference between German and French bond yields)
— Corné van Zeijl (@beursanalist) September 30, 2026
Italy as an example. pic.twitter.com/EqAxVv37oZ
This distrust is visible in the yield gap between French government bonds and German Bunds, the so-called OAT-Bund spread. This week it widened to almost 150 basis points, the highest level since the European debt crisis of 2012. The French ten-year yield came in at around 4.9%. That does not prove that France is unable to pay its debt, but it does show that investors are demanding greater compensation for political and fiscal risk. The comparison with an emerging market is hard to avoid: investors are wondering whether the government can keep its debt under control and whether politicians dare to make unpopular choices. Still, France is fundamentally different. The country has a large, developed economy, borrows in euros and has access to the deep European capital market. The comparison mainly holds in terms of the loss of confidence. That risk could increase if Jean-Luc Mélenchon or Marine Le Pen becomes president in 2027, given the uncertainty surrounding their fiscal and European plans.
| Mélenchon La France insoumise |
Le Pen Rassemblement national |
|
|---|---|---|
| Stance | Radical left: redistribution, bigger role for the state | Radical right: sovereignty, less immigration |
| Budget | Higher public and social spending; wants ECB to write off debt (controversial) | Deficit to a maximum of 3% of GDP; cites €125 billion in savings, details unclear |
| Europe | Will disregard EU rules if necessary | Powers back to Paris; no euro exit |
| Pensions | Retirement age back to 60 | Reverse or adjust Macron's reform |
| Wages and tax | Minimum wage of €1,600 net; higher wealth tax | Lower taxes, more purchasing power |
| Immigration | Generous; regularisation of undocumented workers | Sharp reduction; priority for French nationals |
| Energy and climate | Faster energy transition through state planning | Lower energy costs; opposed to parts of EU climate policy |
Source: LFI and RN party manifestos.
Social pressure is mounting
Social tensions came to a head this week in violent student protests. Students cite staff shortages, overcrowded classrooms and poor facilities as the cause. The unrest is playing out against the backdrop of the approaching presidential election and a budget featuring substantial cuts. Austerity measures risk further fuelling discontent, while delay undermines bond investors' confidence. Without public support, politicians cannot credibly push through necessary reforms.
No French franc to devalue
France no longer has its own currency. It can therefore not devalue the franc to make the economy more competitive. That is an advantage, but also a constraint. The euro rules out a national currency crisis, but it also means France cannot adjust the exchange rate independently. Competitiveness must therefore come from lower labour costs, higher productivity, fiscal discipline and reforms: all politically sensitive. The euro weakened this week partly because of the French tensions, although interest rate expectations and energy prices also played a role. A weaker euro can support exports, but it makes imported energy and other goods more expensive. France cannot offset that with its own monetary policy.
The ECB can buy time, but it cannot solve a budget problem
Monetary policy is made not in Paris, but in Frankfurt. The ECB can step in if financial tensions disrupt the functioning of the eurozone. Through the Transmission Protection Instrument (TPI, an emergency tool to dampen unwarranted interest rate differentials between eurozone countries), it can purchase bonds under certain conditions. It is not an unconditional guarantee for French government bonds: the ECB assesses, among other things, debt sustainability and fiscal policy. The TPI protects the functioning of monetary policy, but it does not permanently shield a country from the consequences of its own budgetary choices. ECB support can help prevent a liquidity crisis, but it cannot force France to structurally control its spending.
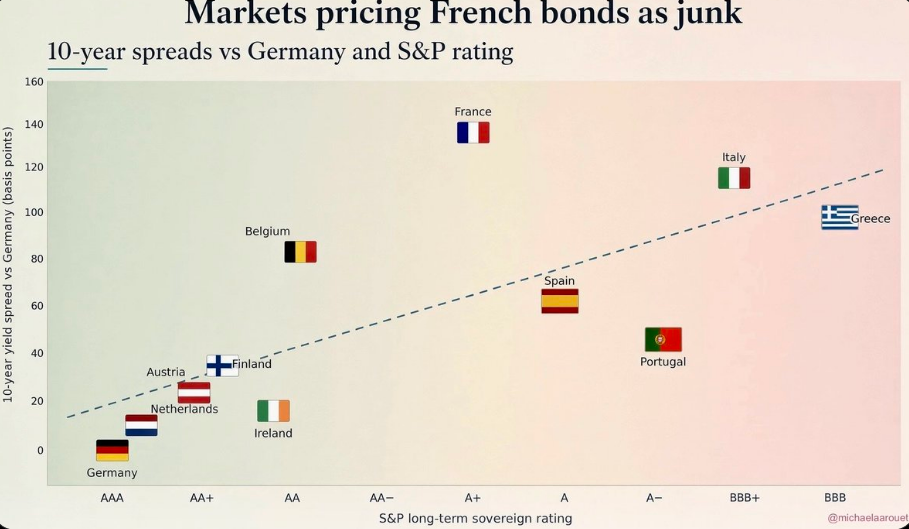
France is not (yet) on the verge of triggering a new eurozone crisis. The combination of high debt, political fragmentation, public resistance to reforms and rising financing costs does make the country vulnerable, though. The spread acts as a thermometer: it measures not only the risk of default, but also confidence that French politicians will get the budget under control. So the question is not whether France will become an emerging market tomorrow, but whether it will make difficult choices in time. If not, investors, businesses and households will ultimately force those choices upon it.
Iran loses its grip on Hormuz: oil exports recover quickly
Besides the budget, Europe has another vulnerability: energy. A weaker euro makes imported oil and gas more expensive, so whatever happens in the Middle East directly affects the eurozone. On that front, the news of the past few weeks has been better than feared. A few weeks ago, the oil market still feared that Iran and its allies in Iraq and Yemen would close off both the Strait of Hormuz and the Red Sea. That doomsday scenario has not materialised. The Gulf states, shipping companies and the US military have organised an emergency route: risky, cumbersome and expensive, but effective for now. Alexander Stahel of Burggraben now estimates oil exports from the Middle East at 94% of the old level. JPMorgan puts the figure for crude oil as high as 98%. Exports of oil products are lagging at around 58%, and the transport of Qatari LNG also remains vulnerable.
The linchpin is the 'Hormuz Shuttle': tankers carry oil along the route past Oman to the Gulf of Oman, where the cargo is transferred to other ships. What started with eleven tankers from the Emirates has, according to Stahel, grown into a fleet of some 116 ships. Saudi Arabia and Kuwait are now also taking part. US coordination helps organise the passages, but does not make them safe. The detour is estimated to cost 28 to 30 dollars per barrel. For a large tanker, that can add up to around 58 million dollars per voyage. So the oil is flowing again, but at a hefty logistical premium.
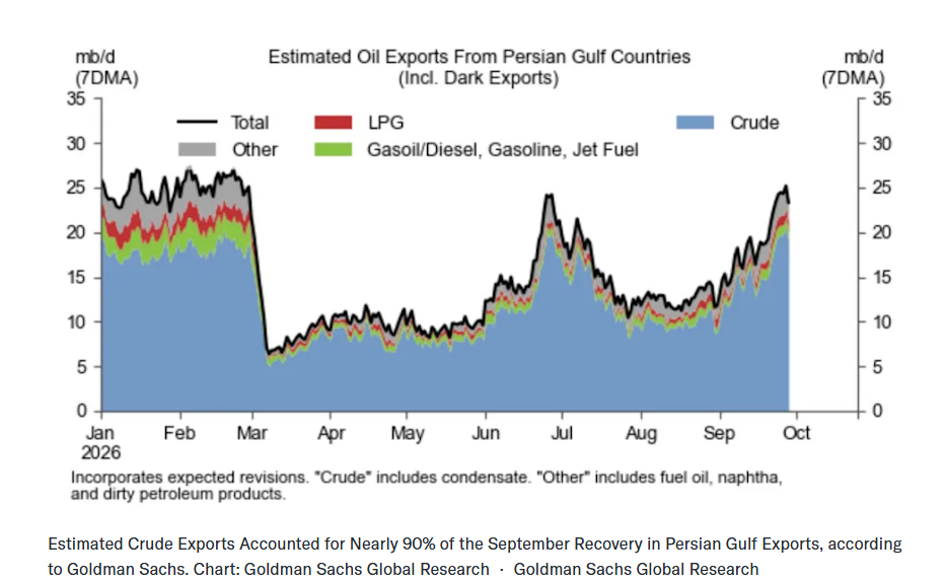
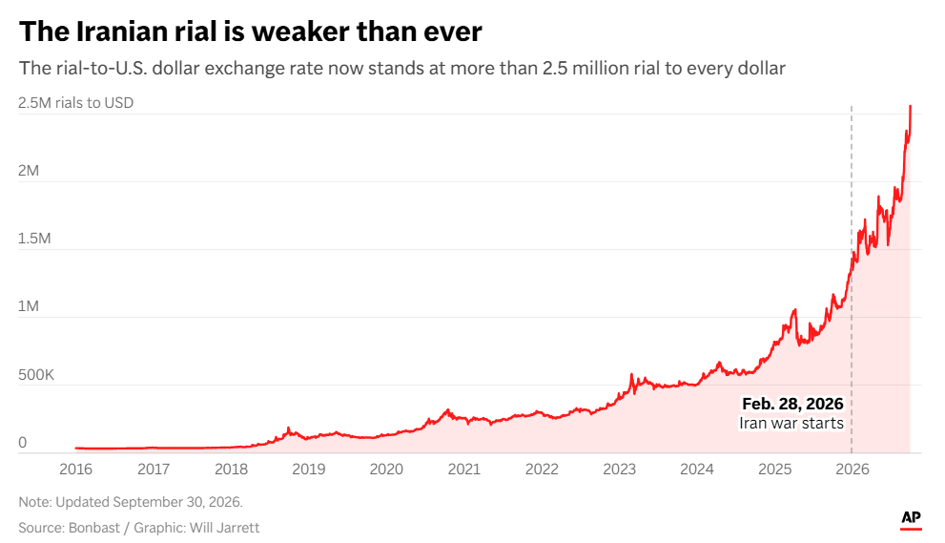
Iran itself appears to be finding it increasingly difficult to export oil. According to Stahel, hardly any oil has been loaded at Kharg Island, Iran's main export terminal, since August. Goldman Sachs also sees Iranian oil exports declining, while those of neighbouring countries recover. Falling oil revenues and high war costs are putting further pressure on the Iranian economy. This is clearly visible in the currency: the Iranian rial is worth less than ever. One dollar now costs more than 2.5 million rial. At the start of the war in late February, that figure was still around 1.5 million. In seven months, the rial has thus lost almost 40% of its value.
US economy remains strong, despite rising interest rates
While the Iranian economy sinks further, the US economy is not easily slowing down for now. Inflation came in lower than expected in August, while consumers stepped up their spending significantly. Industry is also growing: the ISM index (a monthly survey of purchasing managers) registered above 50 for the ninth consecutive month, the threshold that signals growth.
| Indicator | Latest | Expected | Previous |
|---|---|---|---|
| Inflation and spending (August) | |||
| PCE inflation, annual basis | 3.4% | 3.7% | 3.4% |
| Core PCE, annual basis | 3.0% | 3.3% | 3.0% |
| PCE, month-on-month | 0.3% | 0.4% | 0.1% |
| Core PCE, month-on-month | 0.2% | 0.3% | 0.1% |
| Real consumer spending, month-on-month | 0.6% | — | 0.1% |
| ISM purchasing managers' index | |||
| Manufacturing (Sep) | 54.6 | 55.0 | 54.6 |
| Manufacturing, prices paid (Sep) | 77.9 | 72.3 | 71.1 |
| Services (Aug) | 54.4 | 54.1 | 54.1 |
| Services, new orders (Aug) | 60.9 | 56.0 | 57.2 |
Source: BEA, ISM. ISM above 50 = growth.
The lower than expected inflation in August gives the Fed some breathing room, but the picture is not uniformly rosy. Part of the upside surprise is down to revised measurement methods, while manufacturers are in fact reporting rising costs. The ISM index for prices paid rose to 77.9 in September. More expensive energy, partly due to the costly detour around the Strait of Hormuz, is one possible explanation. The combination of robust growth and lower than expected inflation is favourable, but it is uncertain whether it will persist.
Growth forecasts vary considerably. Goldman Sachs expects growth of 2.8% in 2026, supported by tax cuts, consumer spending and corporate investment. For 2025–2029, the bank puts average potential growth at 2.1% per year: the structural growth capacity, not a forecast of actual growth.
Earlier this year, Yardeni sketched a far more optimistic base scenario, with potential growth of 3% in 2026 and 2.5 to 3.5% in the years thereafter. He is counting on AI and other technologies to boost productivity. He still expects growth without a recession, but has recently raised the odds of a gloomier scenario because of rising interest rates. The US government projects average growth of 3.1% per year from 2026 through 2029. By comparison, the Fed estimates growth at 2.3% in 2026 and 2.2% in 2028.
Optimists are banking on AI investment, higher productivity and continued consumer spending. Whether that scenario plays out partly depends on whether AI leads to broad-based productivity gains and whether rising costs don't reignite inflation. The figures from memory chip maker Micron may offer more support for this optimistic scenario.
Micron benefits from tight memory market
In the AI race, most of the attention goes to processors such as those made by Nvidia, but these chips can only run at full speed if enough high-speed memory is available. That memory is precisely what's in short supply, particularly HBM (High Bandwidth Memory). These are stacked memory chips that feed data to AI processors at lightning speed. At the same time, AI servers are demanding ever more ordinary working memory (DRAM) and storage capacity (NAND), which plays entirely into Micron's hands.
The market is split between three players. Alongside the American company Micron, these are the South Korean rivals Samsung and SK hynix. SK hynix has built up a clear lead in HBM, while Samsung, the largest DRAM producer, is trying to gain ground with new generations of HBM. In the broader DRAM market, Micron sits close to SK hynix and is steadily expanding its position. Although competition is fierce, demand is for now growing faster than production.
 Katie Tarasov and Kif Leswing
This is clearly reflected in the figures. In fiscal year 2026, Micron's revenue rose by 256% to USD 133 billion, and for the first quarter of the new fiscal year the company is already guiding for USD 61.5 billion. Investors are buying into that optimism. The share price has risen more than 280% since 1 January, pushing the market capitalisation up from around USD 187 billion to roughly USD 1.24 trillion in twelve months.
| Micron | Actual | Expected | Prior year |
|---|---|---|---|
| Fourth quarter FY2026 | |||
| Revenue | $54.2 billion | $51.3 billion | +379% |
| Net profit (GAAP) | $37.7 billion | — | +1,078% |
| Adjusted earnings per share | $33.42 | $31.72 | +1,003% |
| Adjusted gross margin | 87% | — | 45.7% |
| Full year and outlook | |||
| Revenue FY2026 | $133.2 billion | — | +256% |
| Revenue guidance Q1 FY2027 | $61.5 billion | approx. $57 billion | — |
| Market capitalisation (1 Oct 2026) | approx. $1.24 trillion | — | $187 billion |
Source: Micron, CNBC.
Even so, the memory sector has traditionally seen sharp peaks and troughs. The AI boom could extend this cycle, since building new factories takes years while AI servers consume ever more memory. Gartner estimates global memory revenue at $837 billion in 2026 and expects it to pass the $1 trillion mark in 2027. Bank of America goes even further, projecting a combined DRAM and NAND market of $2 trillion by 2030. These estimates remain uncertain, however, as current revenue is being heavily boosted by exceptionally high chip prices.
Micron itself expects supply and demand to remain tight in 2027 and 2028 as well. More than 75% of production for fiscal year 2027 has already been committed, and 26 multi-year customer contracts give the company greater visibility into future revenue. This makes the outlook exceptionally strong, but the cyclical risk has not disappeared. As soon as new capacity comes online or AI investment cools, prices and margins could fall just as quickly as they rose.
From a K-shaped economy to a K-shaped stock market
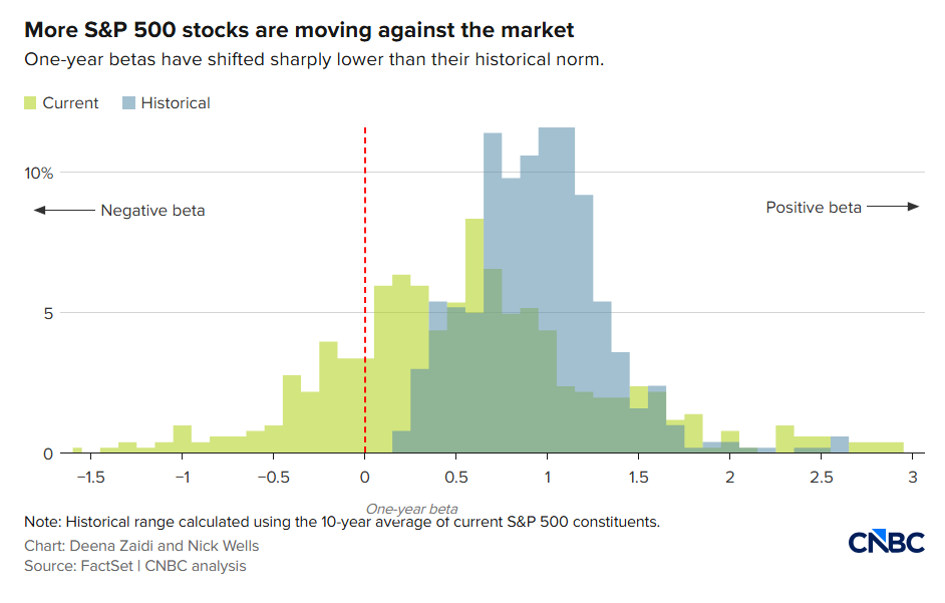
Micron is a textbook example of what characterises the US stock market this year. A limited number of companies with exceptional growth are pulling the index higher, which makes the S&P 500 look strong even as fewer and fewer stocks actually drive that rise. Many other companies are lagging behind or even moving in the opposite direction. In this way, the K-shaped economy, in which one group moves forward while the other falls behind, is finding its mirror image on the stock market. That divide is becoming increasingly visible in the figures. According to Morgan Stanley, the proportion of S&P 500 companies trading above their 200-day average recently fell from around 75% to under 50%, while the index itself held up much better. The number of stocks with a negative beta relative to the index is also notably high. Evercore ISI counted 121 such stocks over the preceding six months as of 31 July, the highest number since the series began in 1990.
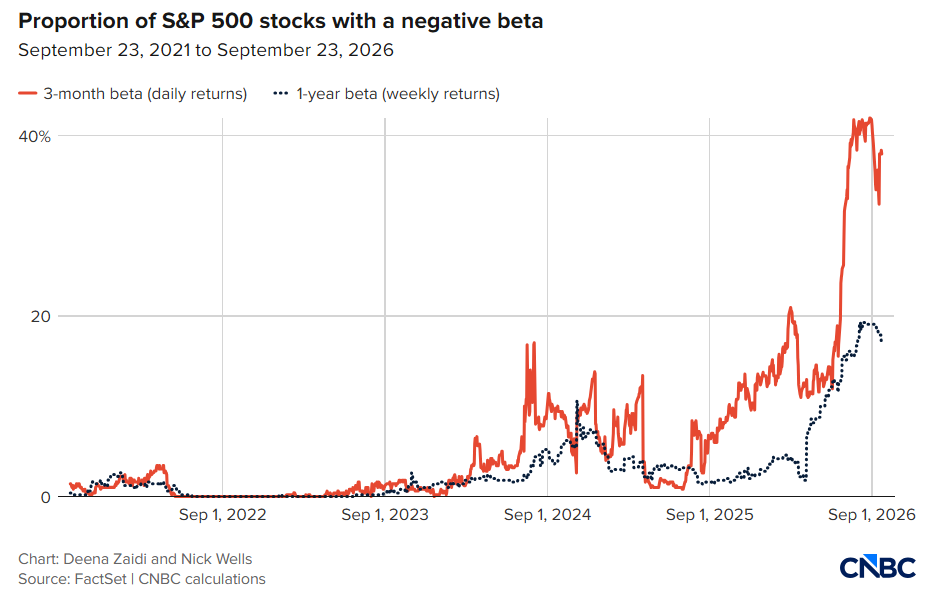
A negative beta means that, on average, a stock moved in the opposite direction to the index over a given period. This does not mean that the stock falls every trading day or offers structural protection, and the outcome also depends heavily on the measurement period chosen. An analysis by Goldman Sachs cited by CNBC put the figure at around 45% of S&P 500 stocks over three months. CNBC's own calculation came to almost 40% over the same period, but just 17% over a full year.
Market-cap weighting reinforces this concentration even further. As a result, a handful of very large technology companies have a disproportionate influence on the index, and their share price gains can mask the weakness of hundreds of other stocks. A calm index can thus conceal a turbulent underlying market. Even so, a lagging share price does not automatically mean a company is doing worse. The narrowing is mainly in price performance, since according to Morgan Stanley, earnings growth at the median S&P 500 company still stands at around 15%. Even financially healthy companies can lag behind when investors flock en masse to a handful of companies and themes.
For investors, the level of the index therefore tells only part of the story. The S&P 500 may contain 500 stocks, but its return depends heavily on a handful of frontrunners, and this affects every investment style in a different way. Passive investors unwittingly end up with a highly concentrated portfolio. Momentum investors keep buying the winners, making themselves even more dependent on a small group of technology stocks. Contrarian investors, by contrast, opt for the laggards, expecting the gaps to narrow again over time. Equal-weighted indices, in which each company counts equally, offer a middle ground with more diversification. In addition, with US interest rates having risen, bonds have once again earned a serious place in portfolios, since new investors now receive a markedly higher coupon than a few years ago.
Receive weekly insights in your inbox
Exclusive analyses and updates on family holding companies and global market developments.
Would you like more information about our services?
Get in touch
Disclaimer:
No rights can be derived from this publication. This is a publication of Tresor Capital. Reproduction of this document, or parts thereof, by third parties is only permitted after written consent and with reference to the source, Tresor Capital.
This publication has been compiled by Tresor Capital with the greatest possible care. The information is intended in a general sense and is not tailored to your individual situation. The information should therefore explicitly not be regarded as advice, an offer or a proposal to purchase or trade in investment products and/or to take up investment services, nor as investment advice. The authors, Tresor Capital and/or its employees may hold positions in the securities discussed, for their own account or for their clients.
You should carefully consider the risks before you start investing. The value of your investments may fluctuate. Past performance is no guarantee of future results. You may lose (part of) your original investment. Tresor Capital disclaims any form of liability for any inaccuracies or errors. This information is purely indicative and subject to change.
Read the full disclaimer at tresorcapitalnieuws.nl/disclaimer .
This article was originally written in Dutch and automatically translated into English with the help of AI. In case of any difference, the Dutch original prevails.